CloudNatix Cloud Cost Visibility Portal
Jack McClary - Member of Technical Staff, CloudNatix
While CSPs offer some visualization and aid in understanding cloud billing, they often are unable to account for every need a customer has and by default do not offer customizable charting. In addition to this, billing files are not extendable to include custom information such as Kubernetes clusters associated with charges, or what business group is incurring the charge.
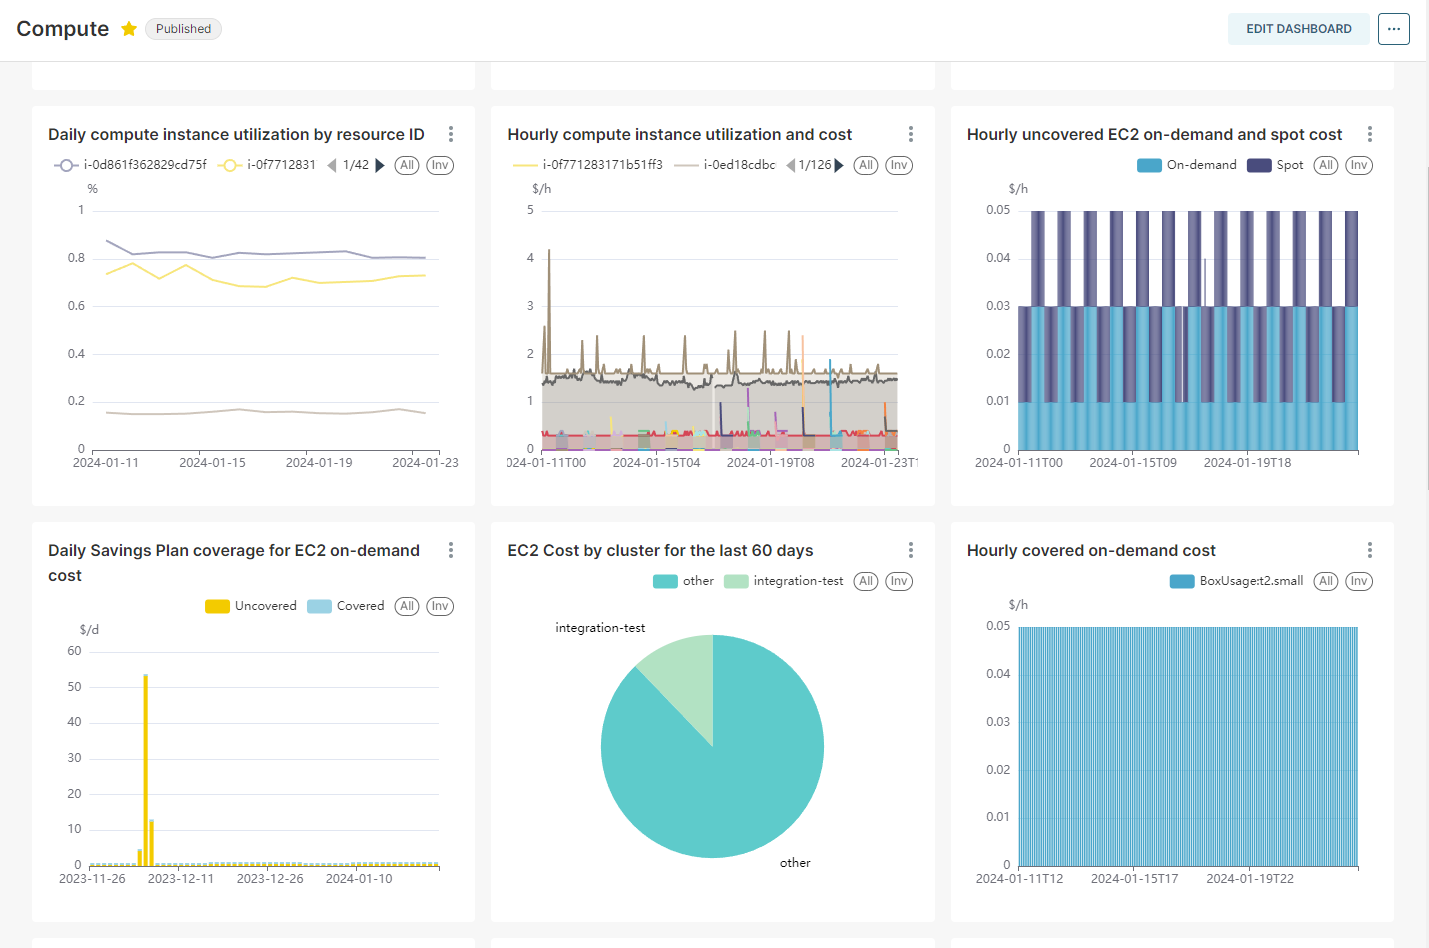
We have created the CloudNatix Billing Data BI Dashboard to automatically collect, extend, and present billing data for customers’ FinOps organizations to be able to understand their billing at a glance. We also implemented support for custom filters across all charts and, best of all, customizability to form whatever dashboard suits your team’s needs. CloudNatix combines CUR files from your AWS system with Kubernetes metrics information gathered directly from clusters (with non-Kubernetes metrics integration under development), to give you all the information you need to get insight at a glance.
By enabling customers to understand their billing files on their own terms, CloudNatix empowers customers to make informed decisions quickly and easily with data visualization instead of struggling through CSV files to get customized understanding.
Setup and Getting Started
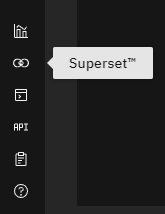
To set up CloudNatix’s Billing Data BI Dashboard, all you need to do is set up an AWS S3 bucket with your CUR files, and grant CloudNatix access to read the files. After that CloudNatix will ingest the CUR files, monitor the S3 bucket provided for new files, and automatically process the data and present it. This can be accessed through the Superset link icon in the bottom left of the CloudNatix web platform that will launch the dashboard hosted by Superset.
At this landing screen you can now see the Dashboards and Charts that CloudNatix provides by default. At the time of writing this, we include “Overview”, “Storage”, “Compute”, and “Compute cost for <Org Name>” for each Org in your CloudNatix Tenant. Using the information in these dashboards you can hit the ground running to understand your system, and if you want to customize your dashboards it is quick and easy to extend them.


